Bianca Sersante
Our Galactic Centre (GC) is an invaluable laboratory to study extreme processes and high energy transients, which in turn can give us a unique chance to gain information about the formation and growth history of Sgr A*.
In particular, when binaries interact with a massive black hole (MBH) such as Sgr A*, they can encounter many different fates.
One of the possibilities is that the BH tidal forces break up the binary, ejecting one component at very high speeds while the other remains bound. The description of this type of tidal interaction is known as “the Hills mechanism”.
Other possibilities are that a binary survives and flies away in the GC on an unbound trajectory, or that it survives but returns on a bound orbit, interacting with the MBH over multiple encounters.
The last possibility is the collision of the binary components.
Project 1 – Dynamical exploration of possible Binary fates
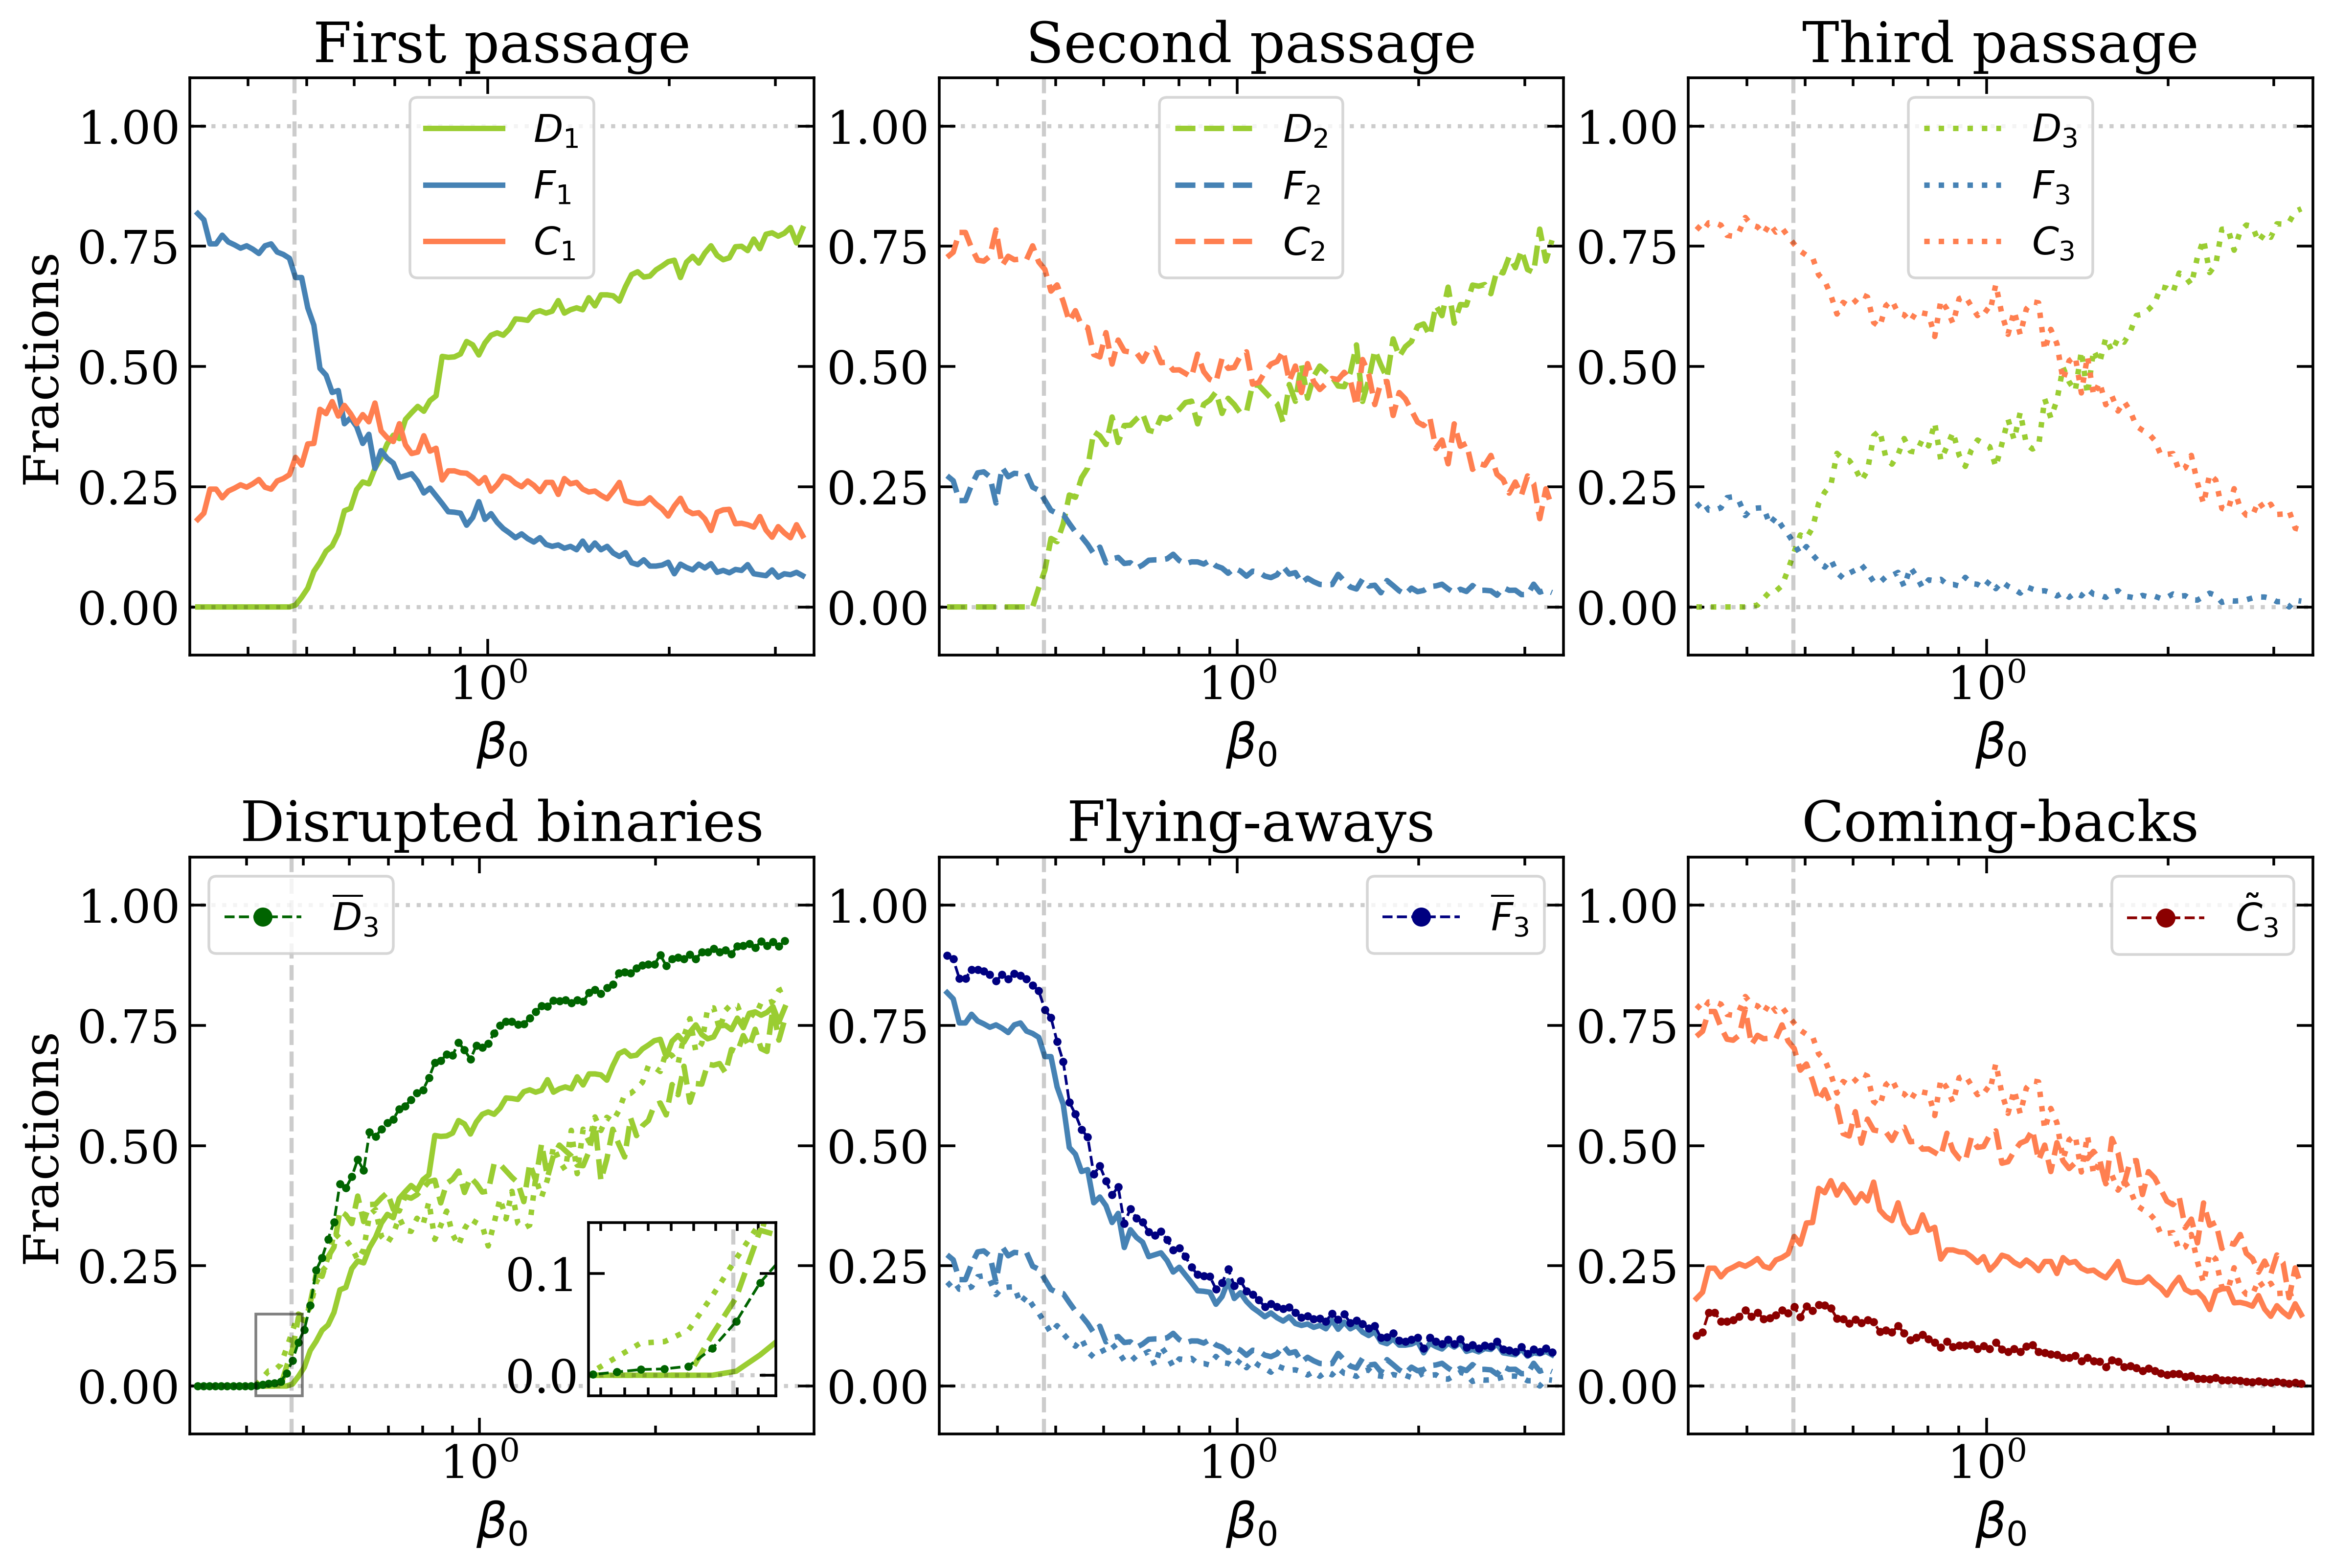
The first project culminated in a paper (you can find the link on top of the page). In this work we analyse how a binary’s fate depends on its orbital parameters, by following its evolution through up to three subsequent pericentre passages. We choose an initial population of circular binaries on parabolic orbits. We present results from our restricted three-body formalism, whose strength lies in the ability to easily explore a multidimensional parameter space and make predictions independent of the binary physical properties. We find that fates depend strongly on orbital inclination, how deep the encounter is into the MBH tidal sphere and on the binary eccentricity, developed during encounters. Generally, non retrograde trajectories, high eccentricities or deep encounters produce disruptions preferentially. Disruption is the most common fate. A significant fraction of the surviving binaries fly away at velocities typically two orders of magnitude smaller than those of ejected stars. Multiple encounters boost disruptions by 20% or more. Finally, using an example system, we investigate the effect of finite stellar sizes and lifetimes, showing that mergers occur 31% of the time, and that disruptions are still boosted by 10% through subsequent passages.
The figure represents the fraction of systems disrupting (D), flying-away (C) or coming back for a second or third interaction (C) as a function of how deep the binary penetrates the BH tidal sphere, going from shallow to deep encounters from left to right.

Project 2 (in progress) – Extreme Mass Ratio Inspirals (EMRIs) through the Hills mechanism:
In collaboration with Prof. Alberto Sesana, Dr. Luca Broggi, Davide Mancieri and Leopoldo Muñoz from the University of Milano Bicocca.
We predict a population of Black Hole Binaries approaching the MBH and analyse their encounter focusing on those that are disrupted. We map the properties of the BHs deposited in the proximity of the MBH as a consequence of binary disruption and follow their evolution as possible EMRIs. The overarching goal is to study EMRIs originated from the Hills channel, to compare with Gravitational waves (LISA) and QPE observations.
The figure represents the orbital properties (semi-major axis and eccentricity) of deposited BHs. The ones between the black and pink line are potential EMRIs.
Project 3 (in progress) – Effect of scattering in shaping the HVSs properties and the stellar population in the GC:
In collaboration with Prof. Nicholas Stone (University of Wisconsin–Madison) and MSc. Ismail Qunbar (Hebrew University of Jerusalem)
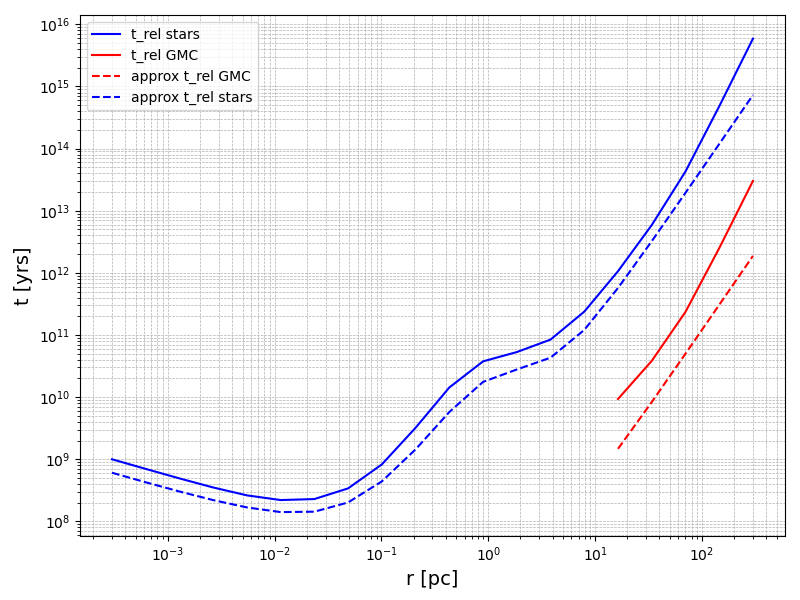
We are characterising the distribution of orbital properties of binaries that can get close enough to the MBH due to scattering with other stars and Giant Molecular Clouds (GMCs) in the GC with the aim of understanding how relaxation processes can affect the stellar population in the GC.
The figure shows the energy relaxation time scales as a function of radius for stars (blue) and GMCs (red). Solid lines are computed using a Monte Carlo framework. Dashed lines show analytic estimates. Stars dominate scattering processes at smaller radii while GMCs at large radii.